#install.packages("ape")

#if (!require("BiocManager", quietly = TRUE))
    #install.packages("BiocManager")

#BiocManager::install("treeio")

#if (!require("BiocManager", quietly = TRUE))
    #install.packages("BiocManager")

#BiocManager::install("ggtree")

#if (!require("BiocManager", quietly = TRUE))
    #install.packages("BiocManager")

#BiocManager::install("SGSeq")Phylogenetic Analysis and Visualization
Intro
Learning how to analyze data to build phylogenies and will be made using genetic data and big datasets. Will be using ape and treeio packages to create formats of evolutionary trees, then playing with ggtree to see how to create different visuals of evolutionary trees. The final goal is to interpret the output of the programs and read an evolutionary tree.
Installing Packages
Reminder: remove and then replace the # for each line of code. Also when there is no package in the library error, try and re-run the prior code and then update it if possible.
library(rbioinfcookbook)
library(SGSeq)
Loading required package: IRangesLoading required package: BiocGenerics
Attaching package: 'BiocGenerics'The following objects are masked from 'package:stats':
IQR, mad, sd, var, xtabsThe following objects are masked from 'package:base':
anyDuplicated, aperm, append, as.data.frame, basename, cbind,
colnames, dirname, do.call, duplicated, eval, evalq, Filter, Find,
get, grep, grepl, intersect, is.unsorted, lapply, Map, mapply,
match, mget, order, paste, pmax, pmax.int, pmin, pmin.int,
Position, rank, rbind, Reduce, rownames, sapply, setdiff, sort,
table, tapply, union, unique, unsplit, which.max, which.minLoading required package: S4VectorsLoading required package: stats4
Attaching package: 'S4Vectors'The following object is masked from 'package:utils':
findMatchesThe following objects are masked from 'package:base':
expand.grid, I, unnameLoading required package: GenomicRangesLoading required package: GenomeInfoDbLoading required package: RsamtoolsLoading required package: BiostringsLoading required package: XVector
Attaching package: 'Biostrings'The following object is masked from 'package:base':
strsplitLoading required package: SummarizedExperimentLoading required package: MatrixGenericsLoading required package: matrixStats
Attaching package: 'MatrixGenerics'The following objects are masked from 'package:matrixStats':
colAlls, colAnyNAs, colAnys, colAvgsPerRowSet, colCollapse,
colCounts, colCummaxs, colCummins, colCumprods, colCumsums,
colDiffs, colIQRDiffs, colIQRs, colLogSumExps, colMadDiffs,
colMads, colMaxs, colMeans2, colMedians, colMins, colOrderStats,
colProds, colQuantiles, colRanges, colRanks, colSdDiffs, colSds,
colSums2, colTabulates, colVarDiffs, colVars, colWeightedMads,
colWeightedMeans, colWeightedMedians, colWeightedSds,
colWeightedVars, rowAlls, rowAnyNAs, rowAnys, rowAvgsPerColSet,
rowCollapse, rowCounts, rowCummaxs, rowCummins, rowCumprods,
rowCumsums, rowDiffs, rowIQRDiffs, rowIQRs, rowLogSumExps,
rowMadDiffs, rowMads, rowMaxs, rowMeans2, rowMedians, rowMins,
rowOrderStats, rowProds, rowQuantiles, rowRanges, rowRanks,
rowSdDiffs, rowSds, rowSums2, rowTabulates, rowVarDiffs, rowVars,
rowWeightedMads, rowWeightedMeans, rowWeightedMedians,
rowWeightedSds, rowWeightedVarsLoading required package: BiobaseWelcome to Bioconductor
Vignettes contain introductory material; view with
'browseVignettes()'. To cite Bioconductor, see
'citation("Biobase")', and for packages 'citation("pkgname")'.
Attaching package: 'Biobase'The following object is masked from 'package:MatrixGenerics':
rowMediansThe following objects are masked from 'package:matrixStats':
anyMissing, rowMedianslibrary(ape)
Attaching package: 'ape'The following object is masked from 'package:Biostrings':
complementlibrary(treeio)treeio v1.26.0 For help: https://yulab-smu.top/treedata-book/
If you use the ggtree package suite in published research, please cite
the appropriate paper(s):
LG Wang, TTY Lam, S Xu, Z Dai, L Zhou, T Feng, P Guo, CW Dunn, BR
Jones, T Bradley, H Zhu, Y Guan, Y Jiang, G Yu. treeio: an R package
for phylogenetic tree input and output with richly annotated and
associated data. Molecular Biology and Evolution. 2020, 37(2):599-603.
doi: 10.1093/molbev/msz240
G Yu. Data Integration, Manipulation and Visualization of Phylogenetic
Trees (1st ed.). Chapman and Hall/CRC. 2022. ISBN: 9781032233574
Guangchuang Yu, Tommy Tsan-Yuk Lam, Huachen Zhu, Yi Guan. Two methods
for mapping and visualizing associated data on phylogeny using ggtree.
Molecular Biology and Evolution. 2018, 35(12):3041-3043.
doi:10.1093/molbev/msy194
Attaching package: 'treeio'The following object is masked from 'package:Biostrings':
masklibrary(ggplot2)
Attaching package: 'ggplot2'The following object is masked from 'package:SGSeq':
annotatelibrary(ggtree)ggtree v3.10.1 For help: https://yulab-smu.top/treedata-book/
If you use the ggtree package suite in published research, please cite
the appropriate paper(s):
Guangchuang Yu, David Smith, Huachen Zhu, Yi Guan, Tommy Tsan-Yuk Lam.
ggtree: an R package for visualization and annotation of phylogenetic
trees with their covariates and other associated data. Methods in
Ecology and Evolution. 2017, 8(1):28-36. doi:10.1111/2041-210X.12628
Guangchuang Yu. Using ggtree to visualize data on tree-like structures.
Current Protocols in Bioinformatics. 2020, 69:e96. doi:10.1002/cpbi.96
LG Wang, TTY Lam, S Xu, Z Dai, L Zhou, T Feng, P Guo, CW Dunn, BR
Jones, T Bradley, H Zhu, Y Guan, Y Jiang, G Yu. treeio: an R package
for phylogenetic tree input and output with richly annotated and
associated data. Molecular Biology and Evolution. 2020, 37(2):599-603.
doi: 10.1093/molbev/msz240
Attaching package: 'ggtree'The following object is masked from 'package:ape':
rotateThe following object is masked from 'package:Biostrings':
collapseThe following object is masked from 'package:IRanges':
collapseThe following object is masked from 'package:S4Vectors':
expandReading and Writing trees
Going to create trees using ape and treeio, using a mammal phylogeny dataset from the R BioInformatics Cookbook (RBC). Going to use the ape package to read the tree in the Newick and Nexus formats.
Newick- evolutionary trees are displayed in text-based format, doesn’t create good visuals, good for computers.
Nexus- next step up, builds on Newick, and adds in character data or the DNA sequences and traits to build the tree. It is noted that neither are good for humans but that it is a good start to a computer analysis.
newick_file_path <- fs::path_package("extdata", "mammal_tree.nwk", package = "rbioinfcookbook" )

nexus_file_path <- fs::path_package("extdata", "mammal_tree.nexus", package = "rbioinfcookbook")

newick <- ape::read.tree(newick_file_path)
nexus <- ape::read.nexus(nexus_file_path)
(chunk is loading the trees into environment to work with. We have started the analysis.)
beast_file_path <- fs::path_package("extdata", "beast_mcc.tree", package = "rbioinfcookbook")

raxml_file_path <- fs::path_package("extdata", "RAxML_bipartitionsBranchLabels.H3", package = "rbioinfcookbook")

beast <- read.beast(beast_file_path)
raxml <- read.raxml(raxml_file_path)
(chunk is loading the data, mammal phylogeny, in two formats used by treeio)
BEAST- Bayesian Evolutionary Analysis Sampling Trees, common tree format, uses Bayesian method to include different rates of evolution and builds up level of analysis to reflect the data.
RAxML, Randomized Axelerated Maximum Likelihood, popular program for phylogenetic analysis (pa) of large data-sets using max likelihoods. Maximum likelihood context - give statistical confidence to evolutionary trees.
(next chunk is going to use the class function to check what type of objects each tree type is, helps to determine analysis function)
(will show that there are two formats, phylo and treedata, can use functions in treeio to inter-convert between them both)
class(newick)[1] "phylo"class(nexus)[1] "phylo"class(beast)[1] "treedata"
attr(,"package")
[1] "tidytree"class(raxml)[1] "treedata"
attr(,"package")
[1] "tidytree"Using the functions in treeio to convert.
beast_phylo <- treeio::as.phylo(beast)
newick_tidytree <- treeio::as.treedata(newick)
Writing the output files.
treeio::write.beast(newick_tidytree, file = "mammal_tree.beast")
ape::write.nexus(beast_phylo, file = "beast_mcc.nexus")
Note: will save files, trees in format that can be read by other pa packages like the Tree of Life Project. For this project the file should be created in the GitHub project folder.
General findings: There are five terminal taxa with the same common ancestor. The rodent and bovine both have no internal nodes. p. paniscus, and h. sapiens make sense as the two terminal species as the most present species. Bovine and rodent are useful in comparing against the internal nodes of the other five mammals of interest and shows the common ancestors and sister groups well.
Using ggtree
tree_file <- fs::path_package("extdata", "itol.nwk", package = "rbioinfcookbook")

itol<- ape::read.tree(tree_file)
(this chunk is showing us how to learn to visualize trees using ggtree. this is also a newick format.)
ggtree(itol)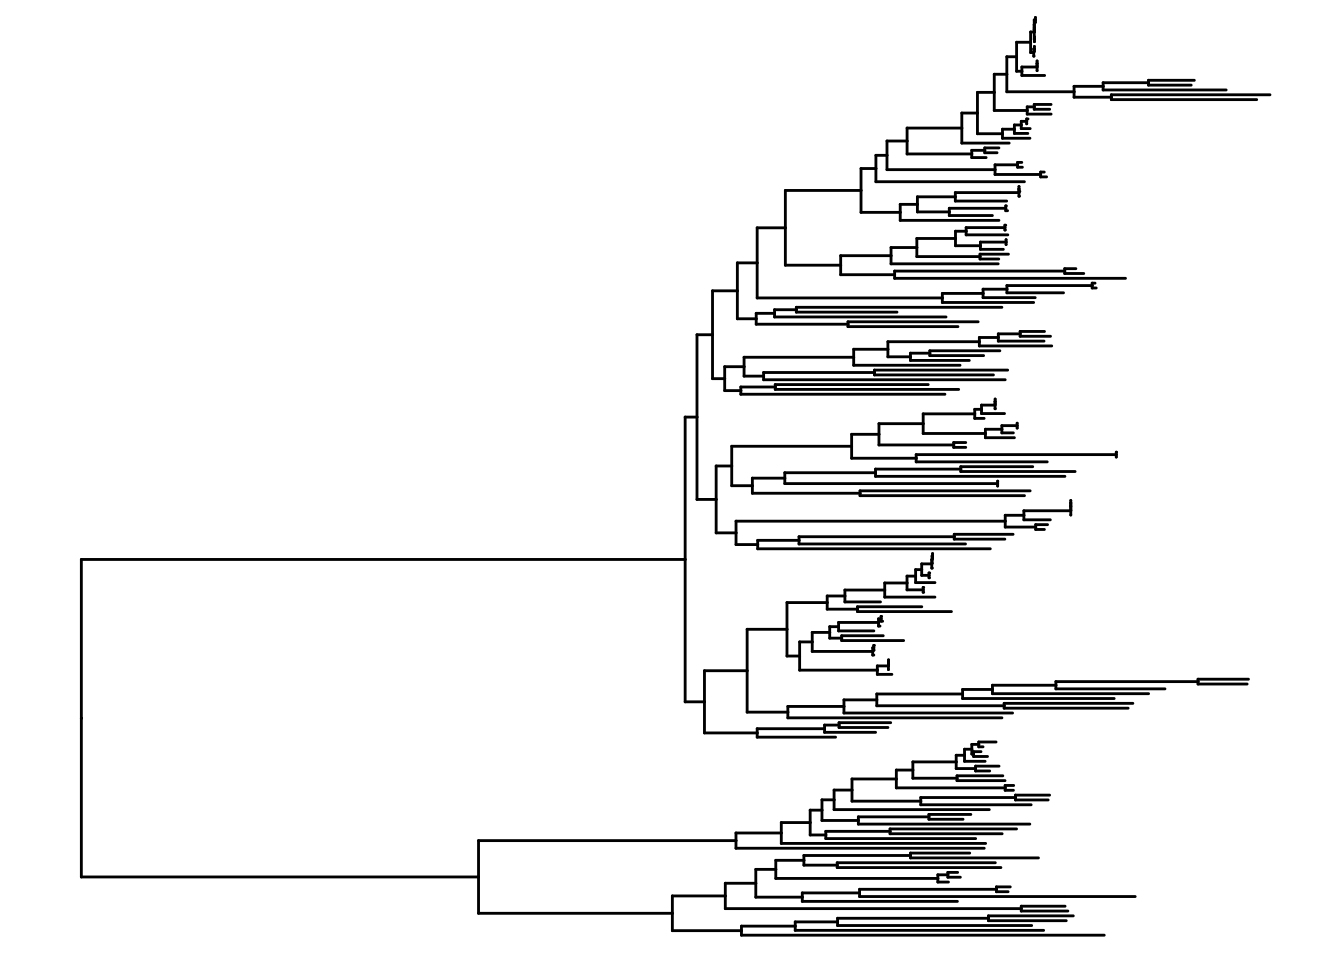
Adding labels to the tree.
ggtree(itol) +
  geom_tiplab(color = "blue", size = 1)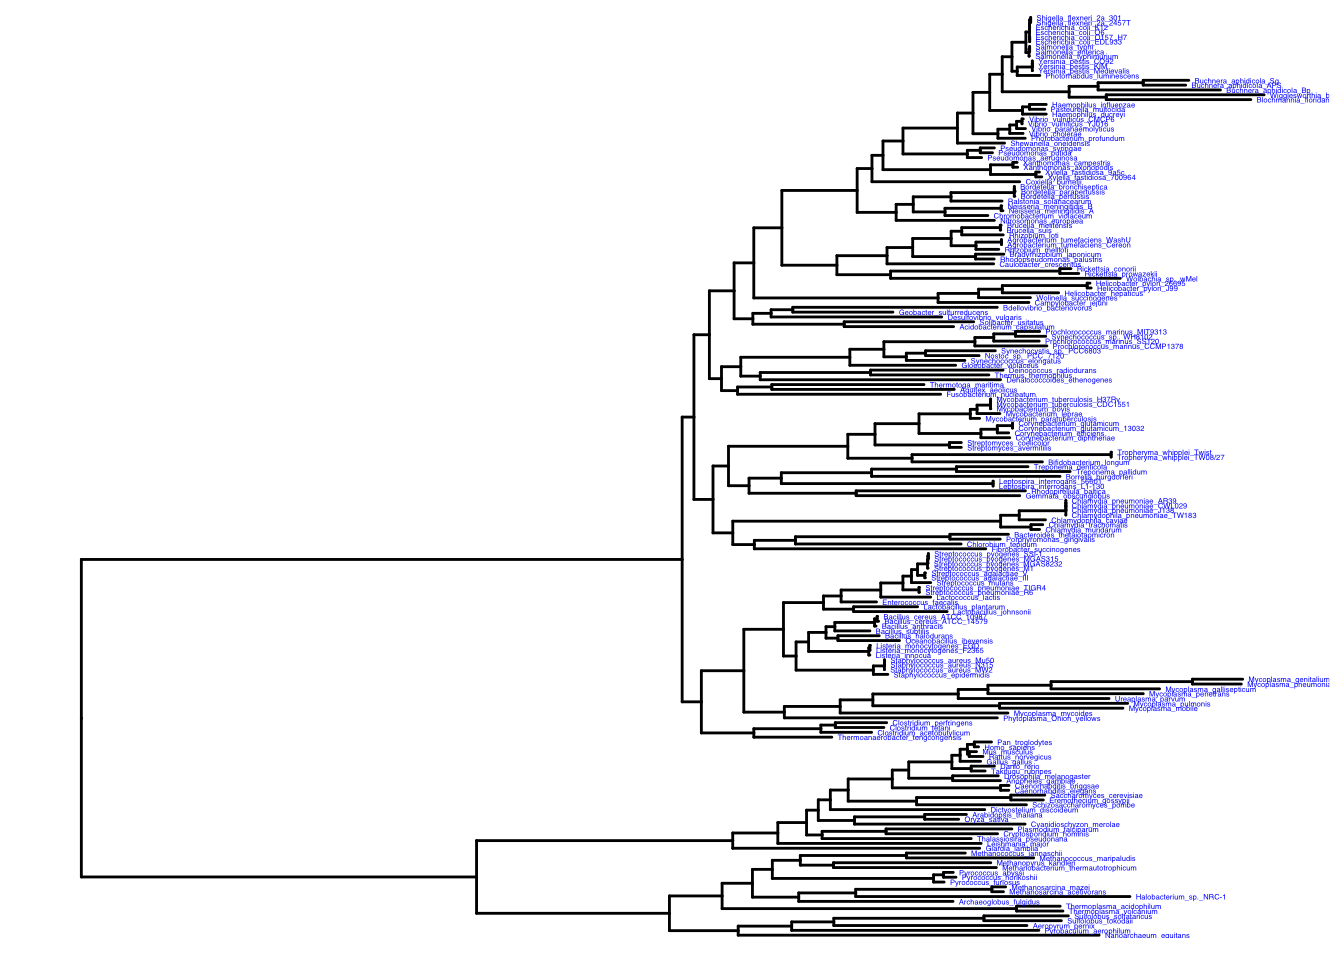
Now we are adjusting the display and going to make a circular plot by adjusting the layout.
ggtree(itol, layout = "circular") +
  geom_tiplab(color = "blue", size = 2)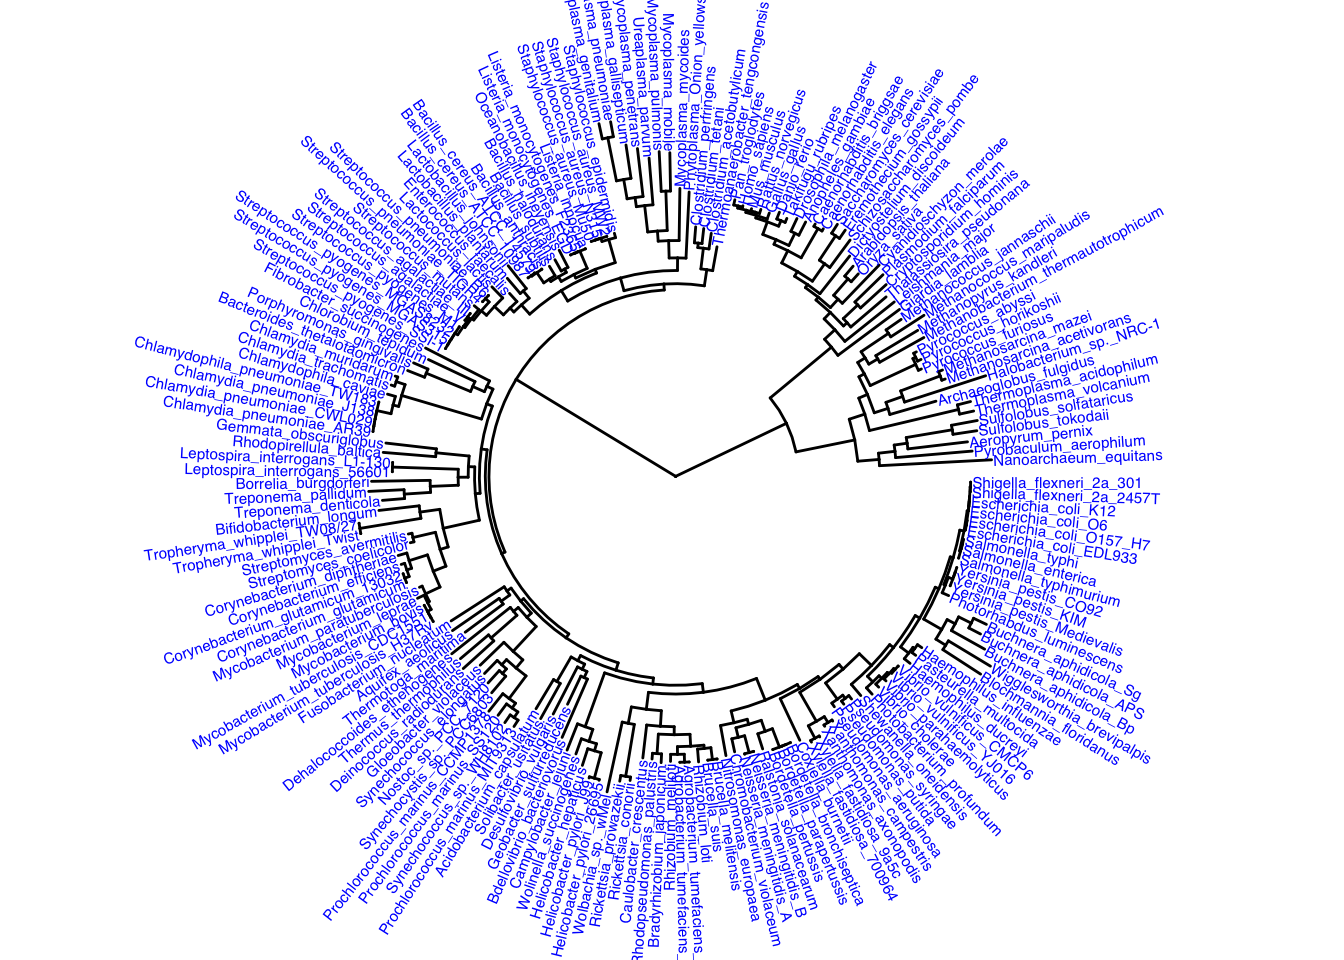
Adding annotations to the tree for practice below. Then adding a strip of color to highlight a particular bacteria clade, it is a red strip
ggtree(itol, layout = "circular") +
  geom_tiplab(color = "blue", size = 2) +
  geom_strip(13, 14, color = "red", barsize = 1)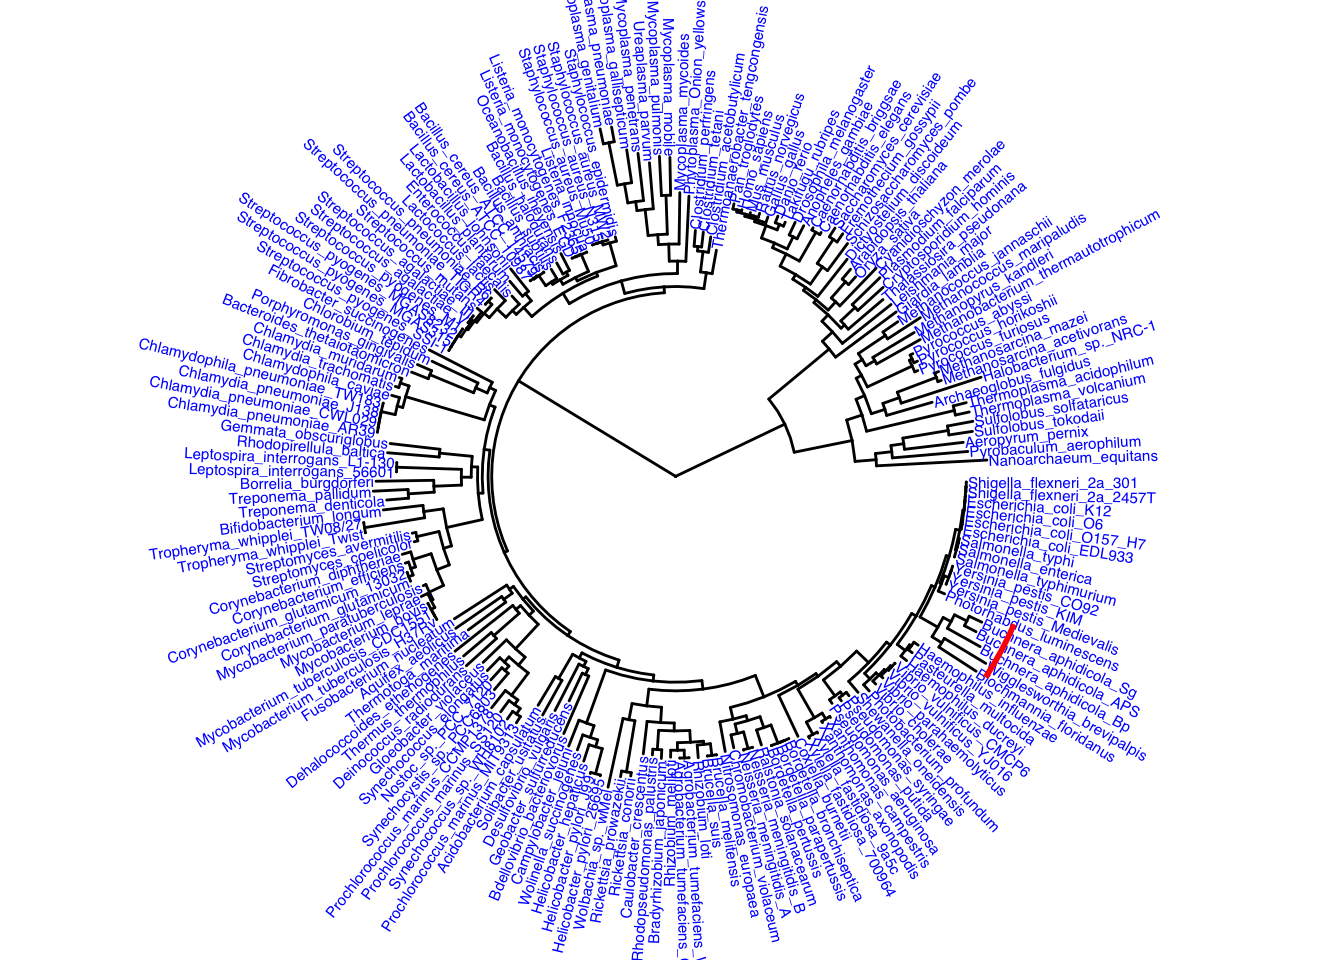
Going to practice changing the way the tree is displayed by inverting it using commands similar to ggplot.
ggtree(itol) +
  coord_flip() +
  scale_x_reverse()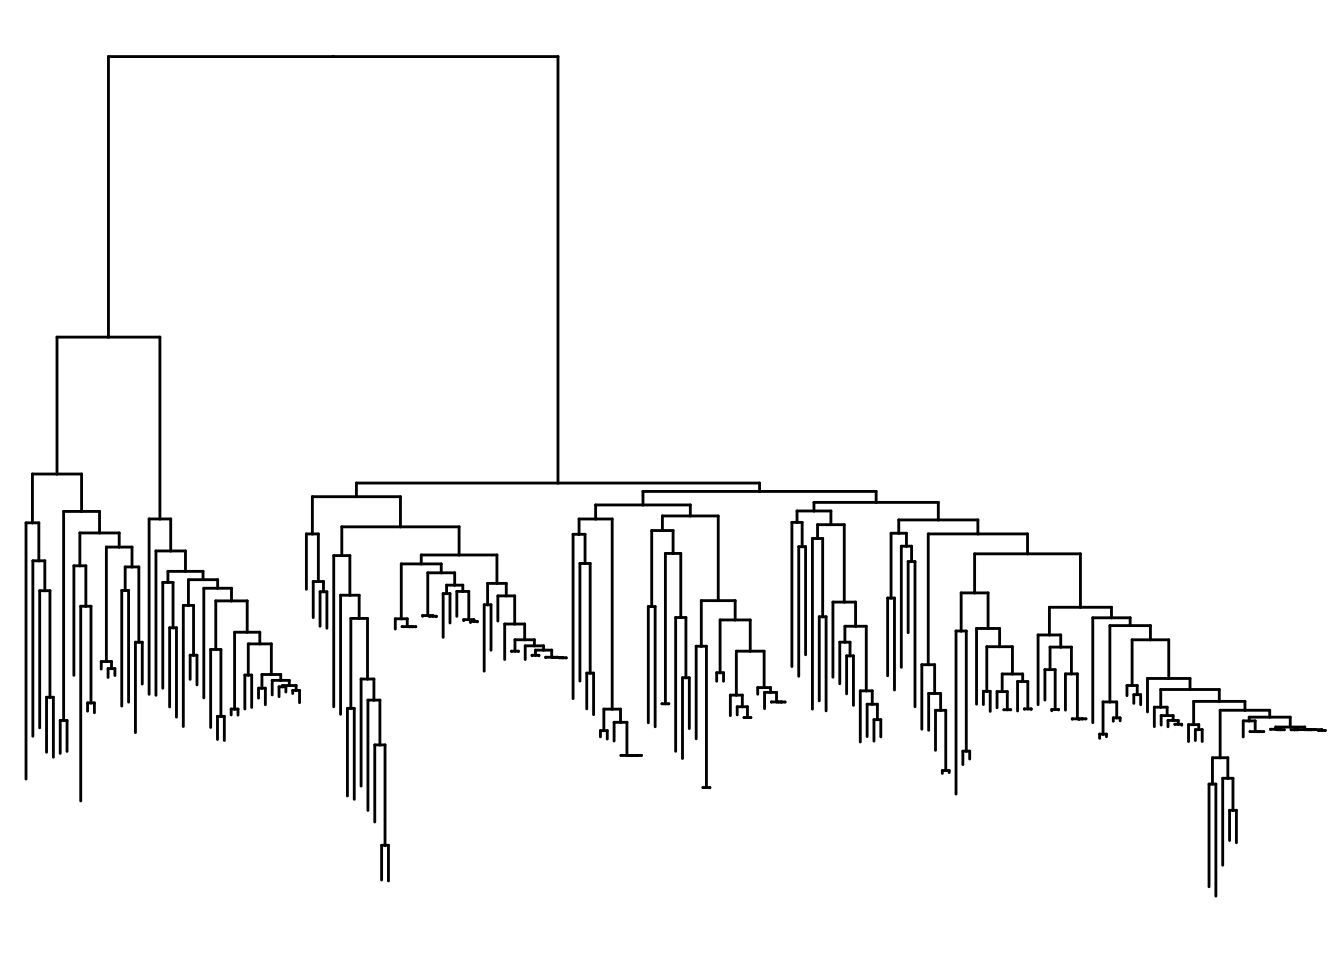
Honestly the circular version was prettier but the next option we can do is display the tree as unrooted. It is noted that unrooted trees don’t use a time component in case we do not know the common ancestors of the species.
The chunk below is going to unroot the tree. (looks like fireworks)
ggtree(itol, layout = "unrooted")"daylight" method was used as default layout for unrooted tree.Average angle change [1] 0.174910612627308Average angle change [2] 0.161645191380678Average angle change [3] 0.129304375923315Average angle change [4] 0.0825706767961184Average angle change [5] 0.100056259084131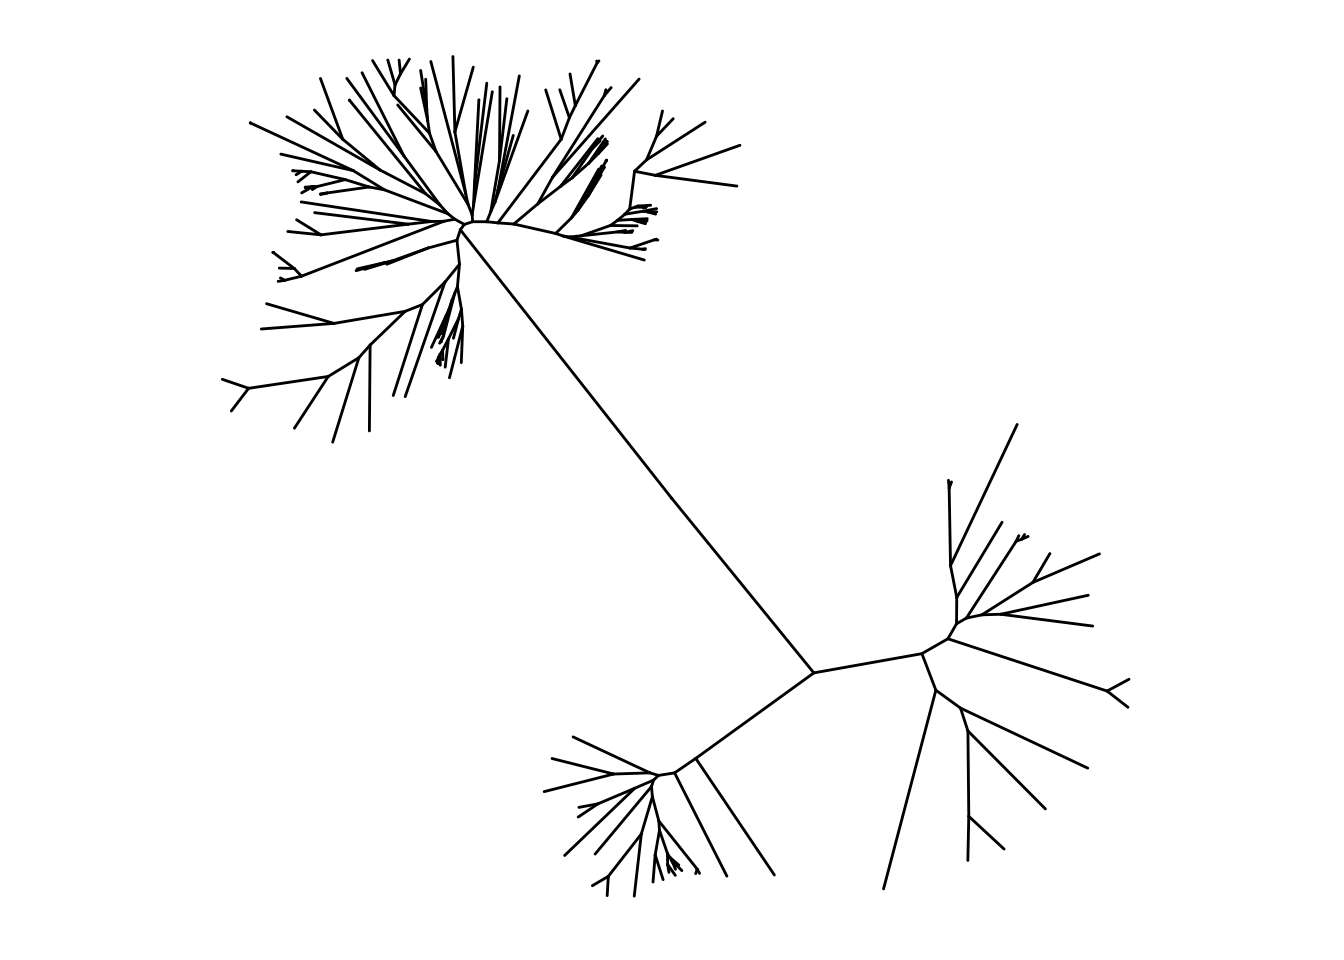
Loading in Newick mammal file
Loading in the mammal Newick file and using ape to read the tree in the chunk below.
(when I did command + shift I think I only ran the second code line and that is why the mammal_file was not found, use the arrow next time)
mammal_file <- fs::path_package("extdata", "mammal_tree.nwk", package = "rbioinfcookbook" )

mammal<- ape::read.tree(mammal_file)
Going to use ggtree to create a basic tree plot in the next chunk. This will also label the terminal species in blue.
ggtree(mammal) +
  geom_tiplab(color = "blue", size = 2)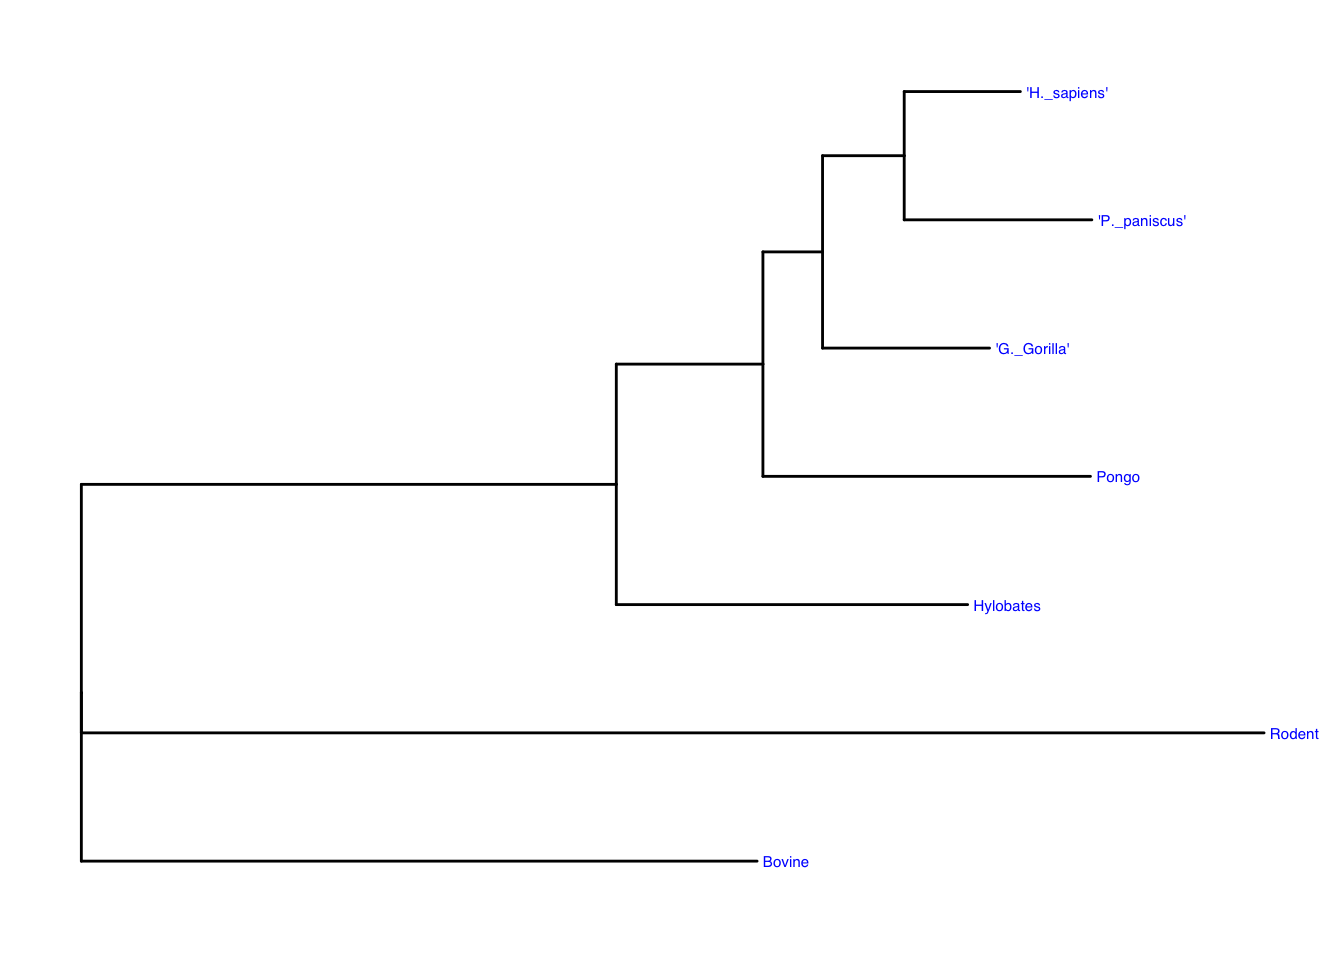
Changing the layout to circular to compare the trees.
ggtree(mammal, layout = "circular") +
  geom_tiplab(color = "blue", size = 2)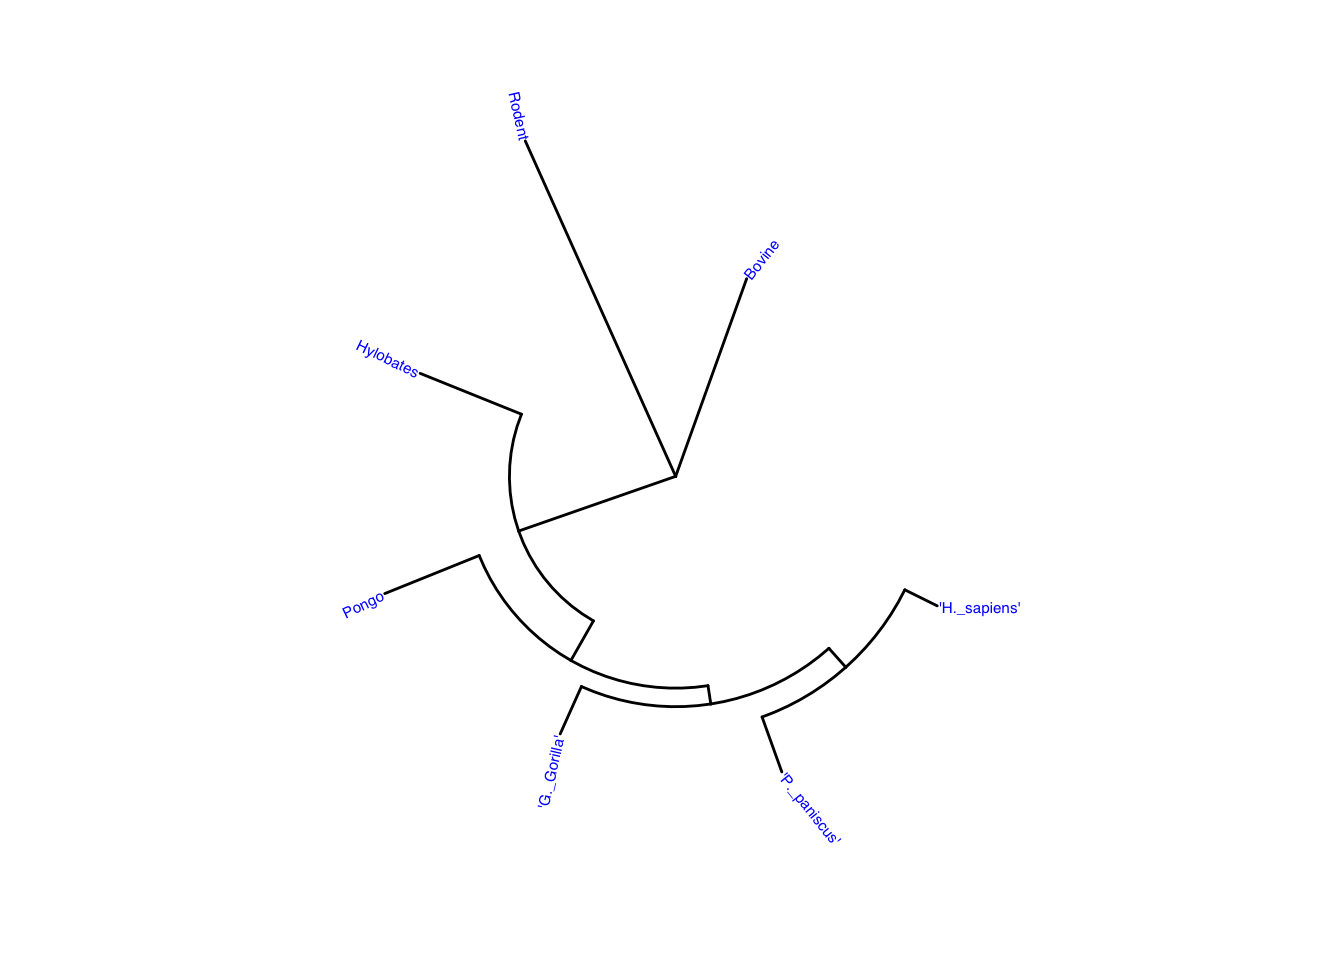
Summary and Debrief
This exercise uses many basics from ggplot and I will have to try some formatting and display alternatives to see what changes in the trees.
I do not understand why a tree would need to be inverted from an analysis standpoint. Also wouldn’t you want to have the tree on a faded grid to see the branch lengths and how they compare to other branches of the the species and their common ancestors or nodes?